

We will be giving timers an Alpha version of RaceDay Scoring at the RunSignUp Symposium next week. Matt Avery will be doing a tutorial and we will be handing out USB’s with the Mac and Windows native versions. We still have a long way to go, but RD Scoring can be used to score a simple, real race. In addition, all the “guts” are there to score complex races. We are looking to get some testing and feedback at Symposium.
This blog is being written beforehand to provide some written instructions and context for either before or after the tutorial. There will be changes between the time of this blog and the Alpha even…
RDScoring has this architecture:

The Connectors, Timing Filters and Scoring Engine are what makes up RDScoring, and is what will be installed as a native Windows or Mac app on your PC.
The main Dashboard of RD Scoring takes you thru the process of setting up a race – mostly in the order of the menu at the left. This interface is likely to change a fair amount to make things easier and hide some of the “raw” complexities that are a bit exposed in the Alpha:

The typical steps to scoring a race are:
- Setup Race. Today this is done by connecting to RunSignUp and syncing race and participant data.
- Timing Devices. This is where the definition of your timing equipment is done.
- Timing Locations. This maps your timing devices to specific locations like Start, Finish, 10K Split, Triathlon Bike Transition Exit, etc.
- Scored Events. Defining which events get scored and mapping the Timing Locations. For example picking the 5K, Then setting the Start and Finish Locations, and defining the Approximate and Actual Start times.
- Segments. Entire Race is the default segment, but you can define any number of segments for things like splits, or triathlon segments like swim, transition, etc.
- Age Groups. Define age groups and gender for scoring. This will expand to have many scoring parameters like Athena and Clydesdale.
- Participants. This is where you can sync and edit and add participants.
- Scoring. This is where you define how you score top finishers (chip or gun time), how many people in each age group, whether there is double dipping, etc.
- Reports. This is where you format and define the output (View, HTML, PDF, Sync to RunSignUp or other API, etc.) your results.
Step 1 – Connect to RunSignUp and Sync Race and Participant Data
The gear icon at the top right takes you to a configuration page where you can set up to point to either RunSignUp Production or RunSignUp Test. Connecting will show a list of races that you can import from RunSignUp. In a later version you will be able to create stand alone races right in RD Scoring.
Once you have added a race you will see it appear in the drop-down list from the top of the page. When you connect to the race all Participant information will be automatically and bi-directionally synced on a regular basis (and you can also force syncs).
Step 2 – Set up Timing Devices
Timing Devices are the ways you are collecting the times. We support a variety of manual, file and chip timing devices. Once Devices are set up, they are available for other races. Timers with chip systems can set up all of their systems.

Setting up an individual Timing Device is fairly simple, and depends on the type of device. For example, here is a view of the standard RunSignUp Protocol that we will be documenting and putting in open source:

We support a variety of devices in the Alpha:

Note also that we have a variety of actions that we can take on devices, depending on what the device offers and our level of support.
Step 3 – Timing Locations

Once Timing Devices are setup, you can then assign the devices to one or more Timing Locations. You should typically have a Start and Finish (Lap Races will get added later), as well as Splits. There are also parameters to filter, such as bib ranges and times. You also set the priority of devices for primary and backup.

Step 4 – Scored Events
A Race may have multiple Scored Events, like a 5K and a 10K. This let’s you set up each Scored Event based on the TIming Locations. In the example below, there are a number of events, and the setup is just for the 5K. Note how it aligns the Starting Point and Endpoint with one of the Timing Locations (Start and Finish).
One of the key parameters here is the entry of the Actual Start Time. This will be used for calculating gun time based off of time of day scored reads during scoring.
Step 5 – Segments
There is a default segment called Entire Race that accepts all of the data defined earlier. The only real data to change would be Endpoint occurrence in case a timing location is being passed several times in a race.

You can add segments for splits and other uses like triathlons.
Step 6 – Age Groups
This is a pretty simple form today, that will gain power as we move toward release. Today it is a pretty manual process for entering in gender and age groups.

Step 7 – Participants
If you are syncing with a RunSignUp race, it will also sync the participant information (bidirectionally). It has search and display capability:

And you can Edit and add participants:

Step 8 – Scoring
We are using a concept called a Listing. A Listing is a way of taking computed fields and doing filtering (like looking for Females 21-40) and Sorts (like sorting the fastest in that filtered group) to produce a Listing Output. The quick view of a listing output will be something like this:

A group os listings will look something like this:

We do not have a User Interface yet to allow you to define Listings yet. Only 3 default Listing Templates, which are mechanisms to read the setup data like Age Groups and Gender, and create each individual Listing. We are including 3 default Listing Templates:

Each Template will read the setup information from previous steps (like Age Groups and Gender) and create each Listing automatically.
Techie Note: Templates are actually JSON files that define how to create a Listing (also a JSON file). This makes the RD Scoring platform very open – where anyone with the proper knowledge can create listing files. And since these Templates and Listings have a standard portable format, they can be shared in the RD Scoring community. This means there could be several different people working on the best XC Scoring Template and it will provide the community with many options and flexibility. In the Alpha version, we give you the ability to download the templates (but there is not documentation yet on how you could do your own). Eventually we will have several wizards and screens in the tool to allow you create Listings and Template Listings easily by clicking and dragging.

Step 9 – Reports (Result Publication)
This is another area that will receive a lot more ease of use features before it goes to production. Right now you have to hand build each report.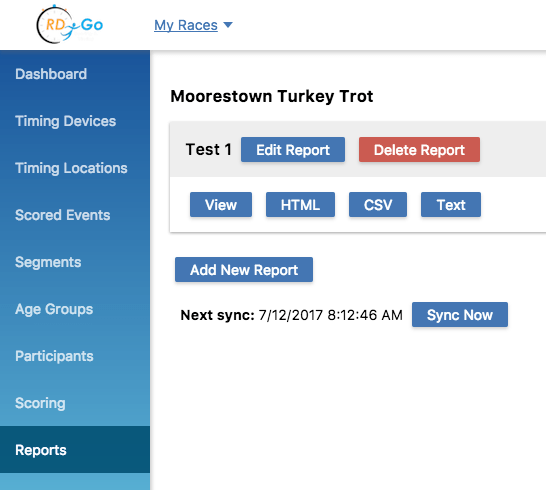
There are several output formats today, with more coming (like API connections to RunSignUp and others). Clicking on View will run the report in RD Scoring. :

This is the report builder today for the above report:

See how Column 1 is multiple fields and we provide a way to concatenate these fields with a space between the First and Last names.
Fields can be static text or they can come from scored read data, participant information or output from the Listings. In this case I am adding a column to show the total number of overall finishers that is being generated by the listing:

Note how I centered the new field and it is added to the Report View:

Summary
As you can see, we have created much of the foundation for the next generation of Scoring. When it is fully released, it should be easier to use than The Race Director, and have the type of customization power that RunScore provides. We are also hoping for a robust community that will share Listings and Report Templates.
We are releasing the Alpha next week to start to get some input and testing. We are hoping to release a Beta in the next couple of months that will introduce more ease of use and configuration, the ability to handle non-RunSignUp races, and much more documentation than this blog.