
(Yes, the double entendre is intentional)
We used RD Scoring last night in a No Frills Prediction Race – and it worked!

We scored it manually – entering in the participants by hand, and then entering in bib numbers and watch times. This is currently functional, but will improve quite a bit by the time we get to Beta.
The setup process is complicated right now since we only have the scoring “engine” built. This will become simpler as we get closer to a Beta with more wizards and preset options.
Below we will go thru the steps to set up and score this race.
Define Race
Currently, you have to create a race in RunSignUp and then Sync with RunSignUp. You will be able to define races in RD Scoring by the Beta.
There is a Sync Settings in RD Scoring that allows you to define fields. When syncing with RunSignUp, fields like Custom Questions will appear. For the prediction race, we asked a customer question of “Predicted Time” – that is what you will see in the last column below under the RDGo label. By the Beta this will have a lot of fields available including things like Giveaway, USAT membership, etc.

Here, you can define RDGo Fields. In this case, we created a field called “predicted_time”. This will be used in our calculation of the Net Time Difference.
Scored Event
You have to set up which scored events you are working on. For this race, there was only one event.

Age Groups
We set up age groups. There is now a quick start, and then this dynamic editor:

Computed Fields
We set up 3 Computed Fields:
- predicted_time_offset_ms – this was the subtraction of their predicted time from the clock time in milliseconds.

Note there are a number of Operations that can be done – in this case we did subtraction:
Note also that by the beta these UI’s will be cleaned up and there will be preset race formats that will hide all of these details.
- Predicted_time_offset – This did a simple transformation from milliseconds into a standard time format:

- abs_predicted_time_offset_ms – This created an absolute value of the predicted_time_offset field. In other words it made negative numbers positive for placement – for example an estimate that was 5 second slower than a person ran would be -5, and the absolute value of that would be 5 seconds.

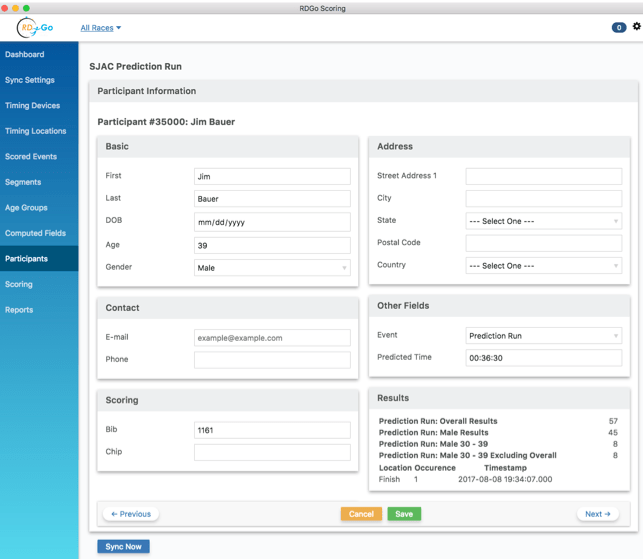
Participants
I added all participant information manually into RD Scoring since it was a no frills race with paper entry. I just entered name, age, gender, bib and predicted time. Remember we set up the Predicted Time field in the Sync Settings where you can define fields (not the computed fields).
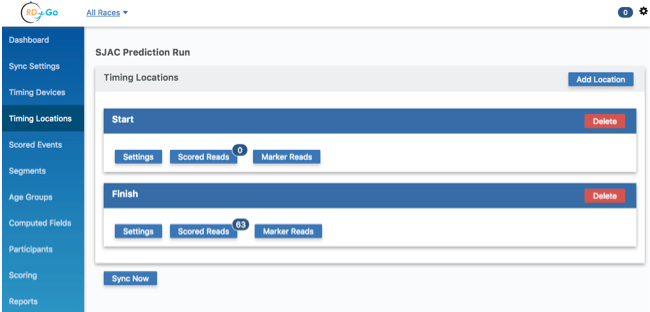
Timing Devices and Locations
Now to enter times!
RD Scoring comes with default timing Start and Finish devices and locations. For this race we could leave Timing Devices alone, and then we did our manual entry of Scored Reads from a watch and paper tape:
Clicking on the Scored Reads for the Finish, we entered the Clock Time option (rather than the timestamps option, which subtracts gun and chip times from start time).

These can be incrementally saved, and they show in a list that allows you to edit and delete:

Scoring
Scoring is done with Listings. RD Scoring has a powerful concept called Template Listings, which is defined in JSON (see end of this blog for the code). Templates read definitions like fields, computed fields, and age groups, and create scoring templates. For example, Overall, Male 20-29, Female 50-59, etc.

Right now these have to be hand made. By the Beta we will have tools to create them, as well as default ones setup for certain types of races
Clicking on a Listing once times have been posted gives you the raw results:

Reports
The reporting tool has a fair amount of power now, but is very raw – there will be a lot of change in this before the beta.
Creating a Report has a couple of parts to it. First, naming the report and selecting the base listing data for the report. In this case, it is for Overall Female, and it is taken from the Listing seen above. Note there is a start and end position, which allows the report to include say the top 3 finishers:

You then add columns. In the example below you:
- Set the Column header name
- Column alignment
- Single Field or Multi-field – Note the first one is single, and the second, Name is multi-field – concatenating the First and Last Names.
- The field is selected from a drop-down of fields, computed fields or scored results like Placement.
- Transformations for different formats like bold, commas, changing milliseconds to seconds, etc.

Adding Columns can be done manually, or there are “quick add” buttons at the bottom of the page.

Once you have added a report, you can add more. Each report can today be viewed in RD Scoring, output HTML, CSV or Text. Uploading to RunSignUp Results will be available by the Beta. This is the view:

Final Notes
One of the coolest things about RD Scoring is that everything is real-time. If you make a change to a participant name, every report and scored listing is updated instantly.
While there is a lot of work to do on the ease of use, the core engine is working well.
JSON file can be found here – https://racedayscoring.blog/wp-content/uploads/2017/08/basicListingTemplates-noFrillsPrediction-1.json_.zip.
Where is the JSON code that is supposed to be at the end of blog mentioned under Scoring
“Scoring is done with Listings. RD Scoring has a powerful concept called Template Listings, which is defined in JSON (see end of this blog for the code).”?
Sorry – we posted on the RDScoring blog. Here is a link – https://racedayscoring.blog/wp-content/uploads/2017/08/basicListingTemplates-noFrillsPrediction-1.json_.zip.
Thanks!